“A rare cicada emergence that hasn’t been seen in more than 200 years will hit Illinois this year, but when can you expect it to all unfold?
The 2024 cicada explosion will see two different broods of cicadas — one that lives on a 13-year cycle and another on a 17-year cycle — emerging from underground at the same time, bringing billions to the surface.
The rare dual emergence hasn’t happened since 1803.
“While any given 13-year brood and 17-year brood can occasionally emerge at the same time, each specific pair will see their cycles aligned only once every 221 years,” NBC News reported. “What’s more, this year’s cicada groups, known as Brood XIII and Brood XIX, happened to make their homes adjacent to one another, with a narrow overlap in central Illinois.” Continue reading
That means Illinois will be in a unique position to witness the event– but when will it happen?
Cicadas typically emerge as the ground begins to warm in the spring and early summer.
Typically, that means an emergence between mid-May and early June, though some could start as early as late April.
According to an article from the University of Illinois Urbana-Champagne Extension, the Northern Illinois Brood’s emergence typically occurs in May and June, and lasts approximately four weeks. Although mostly harmless, the noise of the insects can be disruptive, the university said. Additionally, eggs from adult cicadas on twigs and shoots could cause “substantial damage” in newly planted orchards.
And the Northern Illinois Brood itself is huge, with a reputation for the “largest emergency of cicadas anywhere,” according to the university.
In 1956, entomologists reported as many as 311 “emergence holes” per square yard in a forested floodplain near Chicago, which experts say translated to 1.5 million cicadas per acre, according to the University of Illinois.
“When the cicadas start dying and dropping from the trees later in the spring, there are large numbers on the ground, and the odor from their rotting bodies is noticeable,” U of I reports. “In 1990, there were reports from people in Chicago having to use snow shovels to clear their sidewalks of the dead cicadas.”
Meanwhile, Brood XIX cicadas have a more widespread population, covering parts of Missouri, Illinois, Louisiana, North Carolina, Virginia and Maryland.
In 2028, the Mississippi Valley Brood known as “Brood XXIII” are expected to emerge in Southwestern and Southeastern Illinois, though some “stragglers” from that bunch could also appear in 2024, the University of Illinois reported.
“Most of the state of Illinois will experience periodical cicada emergence in 2024,” the university said. “Besides the noise, which may be substantial, this large group of insects is harmless and can be appreciated and enjoyed by nature lovers of all ages.”
Male cicadas can reach decibels similar to a lawn mower or passing jet, and their numbers will be large, but their life cycle is short, at just four to six weeks. Then, the adults die but leave behind a new generation. Those nymphs will live underground until the year 2038.
In a year of full emergence, when the bugs surface, they quickly begin mating, which is often met with the noise most associate with cicadas.
“Once those cicadas are out of the ground, it’s all about romance,” Mike Raupp, Professor Emeritus of Entomology at the University of Maryland, previously said.
Cicadas don’t bite or sting and pesticides will not work on periodical cicadas, experts say.”
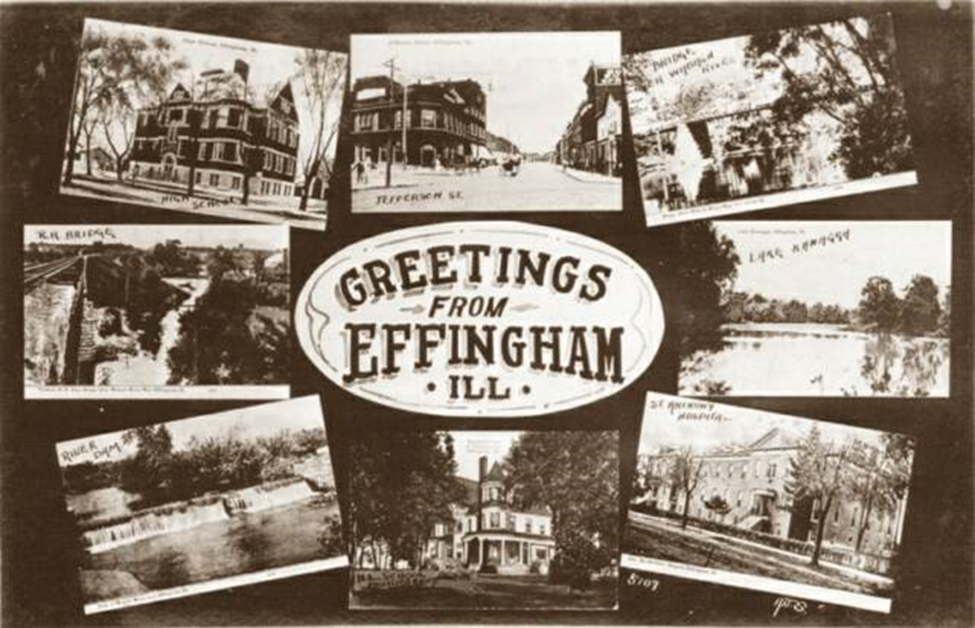
From its start in the farming industry to being a present-day manufacturing hub for the region, Effingham has continued to conform with the ever-growing changes that the future brings. Effingham, IL is located where I-70 and I-57 converge in the county that bears the same name making it the ideal location for both rail and roadway trade. First settled in 1814, this community has seen consistent growth over time.
History
Originally known as Broughton until 1859, the origins of the town name “Effingham” are not readily known. Some say it came from a general and local surveyor with the surname. Others believe the community was named for Thomas Howard, the 3rd Earl of Effingham, who resigned as general in the British Army in 1775 because he refused to serve in a war against the colonies (Effingham, Illinois).
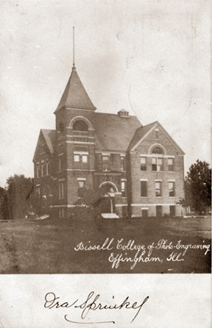
Bissel College of Photo-Engraving
Getting a head start on building an economy through industry, some of Effingham’s earliest residents established Austin College in the late 1800s. After many years, it turned into the Illinois College of Photography until closing in the 1930s because of low enrollment numbers during the Great Depression (Effingham, Illinois). It was said that students graduating from this school were able to “go out fully equipped and the fact that they are alumni of the Illinois College of Photography is a guarantee that they are artists in their lines. A diploma from this institution assures them the most remunerative positions in the best studios in the country.” (Illinois College of Photography).
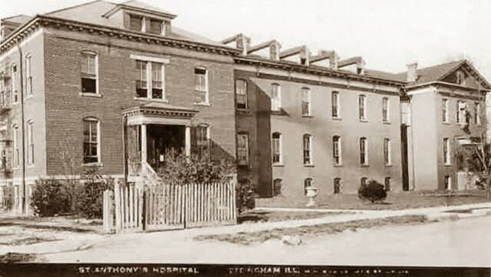
Effingham is also home to St. Anthony’s Hospital which has a long and storied history in the region. The only medical facility of its kind in the county since 1873, the nuns from the convent next door managed the care of patients. It was known to be sanitary and well-maintained but lacking much of the technology frequently used for its time. A 100-bed facility, it was built “…mainly out of wood and brick…contained open corridors and staircases and many of the walls were covered with oilcloth fabrics and combustible soundproof tiles.” (St. Anthony’s Hospital). Just two years from building a new facility, a fire broke out on April 4, 1959. With no fire suppressions, alarms, or architectural features that would help control the fire, the building was quickly consumed. Thanks to the heroic efforts of doctors and nurses 42 out of the 116 patients were rescued from the inferno. Since the structure lacked fire systems, there was a delay in alerting first responders. By the time the 26-man volunteer fire department arrived, it had reached the roof. With assistance from mutual aid departments, they were able to stop the spread to additional buildings, but the hospital was destroyed. While this event was an unmistakable tragedy, current governor at the time, Adlai Stevenson, had the State Fire Marshal inspect all hospitals in Illinois to find possible safety hazards. What happened that night at St. Anthony’s Hospital paved the way for all hospitals to “…incorporate numerous fire safety features to protect patients who cannot be quickly evacuated, including fire barriers, smoke compartments, and stairway enclosures” (St. Anthony’s Hospital). These policies still stand today and have no doubt saved countless lives in the process.
St. Anthony’s Hospital
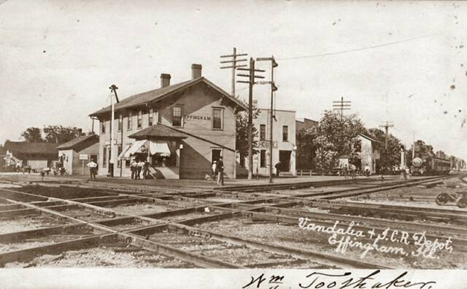
One common theme running through Effingham is the heart symbol. The local high school mascot is the Flaming Heart. In downtown can be found the Heart Theater. This is because Ada Kepley, a local activist and lawyer, dubbed the city “the heart of the U.S.A.” and it stuck. In fact, during the 1920s to 1940s, the train station had in area covered in brick with walkways, a green space, and red heart marked in it (Van Bergen, A.).
Effingham Depot
Present Day
Today, Effingham is a bustling town full of industry, the top three being manufacturing, distribution, and agriculture (Regional Employers). The town currently boasts over 60 different businesses. They have an expansive industrial park and the city continues to grow in both population and investment. Effingham also boasts at least two park spaces, an extensive walking trail, a golf course, and easy access to Lake Sara with plenty of camping sites for those looking to get outdoors. Additionally, there are over 20 meeting centers for individuals looking to hold large gatherings.
Tourism
For those visiting the region, Effingham’s tourism department has put together ideas of must-visits that have been included below.
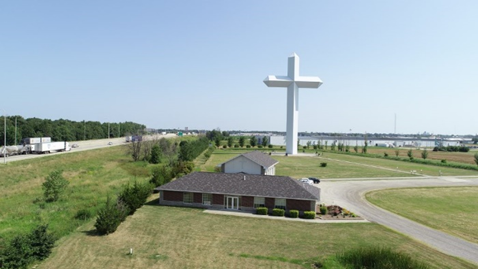
“Effingham boasts an array of attractions that cater to various interests, from our 198 ft. tall interstate icon, The Cross at the Crossroads, to our eco-conscious farm-to-table eatery, Firefly Grill. We have one-of-a-kind destinations like John Boos & Co. Factory Outlet and Showroom – the only one of its kind, where you can purchase the same products the pros on the Food Network use at a fraction of the price. And for car enthusiasts, we have Mid America Motorworks, a paradise celebrating all things Corvette, drawing car aficionados from around the globe. Plan to see a live performance of one of the Effingham Performance Center’s nationally-recognized acts like, LeAnn Rimes, 38 Special or John Michael Montgomery. Enjoy wine tastings and live music at Tuscan Hills Winery and sample our vibrant culinary scene by trying some of our 65+ restaurants!
Cross at the Crossroads
The city’s annual festivals add vibrancy to Effingham’s cultural tapestry. Want to attend a music festival? Take your pick! Enjoy bluegrass and Americana folk music at Moccasin Creek Festival this summer or stomp your boots at the Rusty Reel Lake Jam in the fall. The Effingham County Fair is another time-honored tradition showcasing agricultural heritage, while the Effingham Artisan Fair highlights local craftsmanship and creativity. For those seeking a taste of local flavor, the Effingham-Jam BBQ Cook-off tantalizes the taste buds with delicious concoctions. Check out our event calendar to learn more!
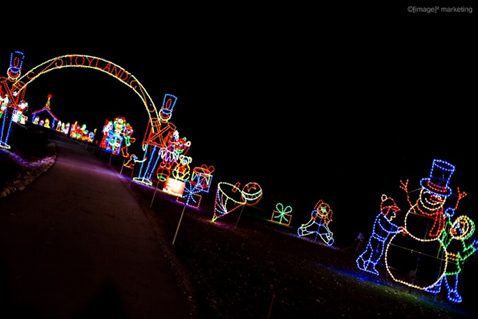
As for the event we’re proudest of in Effingham, it’s the Walking through Wonderland event, hosted by Visit Effingham. This Hallmark-inspired holiday event is truly the shining star of our local events. We bring the magic of the holiday season to life with a walk through our holiday light displays, live music, visits with Santa, holiday crafting, magic snow and more. Walking through Wonderland is a once-a-year, up-close-and-personal, can’t-miss experience for those who love Christmas.
Walking through Wonderland
For tourists, must-visits include our vibrant downtown area, with its eclectic shops, local art and diverse restaurant scene – a delightful stop to soak in the local ambiance. Be sure to make a reservation at Firefly Grill, as well. This acclaimed restaurant offers a farm-to-table dining experience unlike any other. Of course, a visit to Effingham wouldn’t be complete without a stop at The Cross at the Crossroads. Take a selfie next to this larger-than-life symbol. Ultimately, Effingham is destination that caters to a wide range of interests, ensuring there’s something special for every visitor to enjoy.” -Effingham, IL Tourism Department
Conclusion
This micropolitan hub for manufacturing has seen consistent growth since its inception as Broughton. Effingham continues to evolve with changes in technology and the workforce making it an incredible asset to Illinois as a whole. Not only does it offer many opportunities for economic development within the region, the members of this town have made a concerted effort to provide plenty of opportunities for leisure. Make sure to stop and visit to see all that this town has to offer!
The Illinois Transportation Enhancement Program funded through IDOT provides eligible entities an opportunity to provide safe methods of alternative modes of transit. The application cycle runs during even numbered years, opposite from the Safe Routes to School grant. IDOT anticipates accepting their next set of applications by August 2024.
Background
There are currently 9 categories of projects eligible for grant funding. They include the following:
“Pedestrian/Bicycle Facilities
Streetscapes
Conversion of Abandoned Railroad Corridors to Trails
Historic Preservation and Rehabilitation of Historic Transportation Facilities
Vegetation Management in Transportation Facilities
Archaeological Activities Relating to Impacts from Implementation of a Transportation Project
Storm Water Management, Control and Water Pollution Prevention or Abatement Related to Highway Construction or Due to Highway Runoff
Reduce Vehicle-Caused Wildlife Mortality or Restore and Maintain connectivity Among Terrestrial or Aquatic Habitats
Construction of Turnouts, Overlooks, and Viewing Areas”
Depending on the type of project, there might be a matching requirement. Engineering costs are typically covered up to a certain amount.
Conclusion
The ITEP grant is an opportunity for communities interested in investing in alternate modes of transportation or rehabilitation of historical transportation facilities, among other eligible projects. The funding cycle is anticipated to open soon so there is still time to get an application submitted. If you are interested in this grant or other funding opportunities, call SCIRPDC today!
The University of Illinois-Chicago research team led by Dr. Jane Lin, Professor of sustainable transportation systems in the Department of Civil, Materials, and Environmental Engineering, has been commissioned by the Il. Dept. of Transportation’s Office of Intermodal Project Implementation (IDOT-OIPI) to investigate the non-emergency medical transportation barriers related to medical trips in rural Illinois.
Currently, the use of paratransit services is especially difficult in rural Illinois because these transit services may require multiple transfers to get to one’s appointment and may not be offered where and when medical appointments are available. This study will identify the barriers and factors contributing to those barriers and propose improvements to the system by which medical patients receive transportation services in Illinois, including facilities specifically for veterans around the state.
As part of the study, a Technical Advisory Committee (TAC) has been formed to provide guidance to the research team. The TAC members are composed of relevant agencies and stakeholders to the study. Terri Finn & Riley Anderson, Human Service Transportation Coordinators at SCIRPDC, have been selected as members of the TAC.
The study will begin in January 2024 and conclude with a report of findings being sent to IDOT\OIPI in August of 2025.
The study will include research team members interviewing patients\transit riders from around the state getting first hand input on problems that are encountered from the scheduling process through to the actual appointment trip.